Using the toolbar
Use the toolbar button to open the toolbar options.
Image

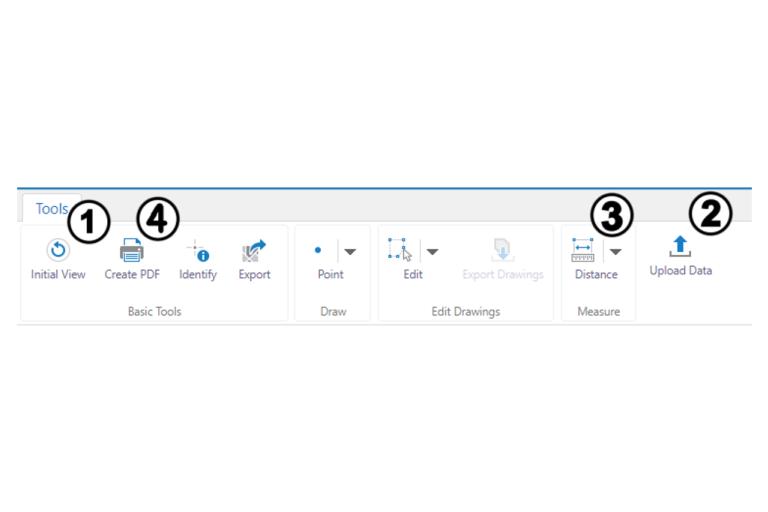
- ‘Initial view’ will return the map to where it first opens.
- ‘Upload data’ lets you add any data with coordinates to view temporarily on the map.
- ‘Distance’ lets you calculate areas or length.
- ‘Create PDF’ lets you choose orientation and see a highlighted red area, which is the area that will be printed.
Drawings
Image

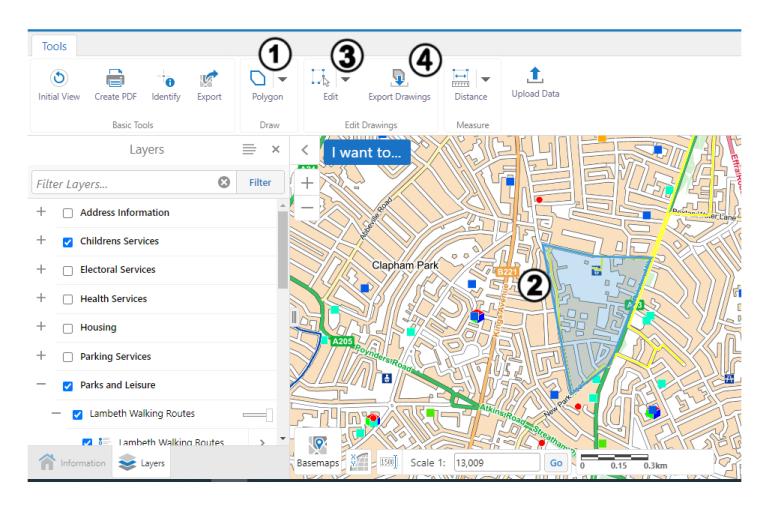
- Use the arrow in the ‘Draw’ section of the toolbar to choose text, shapes, or create your own polygon.
- Click on the map to start drawing. If you’re drawing a polygon, you must double-click to finish your drawing.
- You can edit any drawing or shape after you’ve created it.
- You can export any drawing to be used in mapping software.
The identify tool
Image

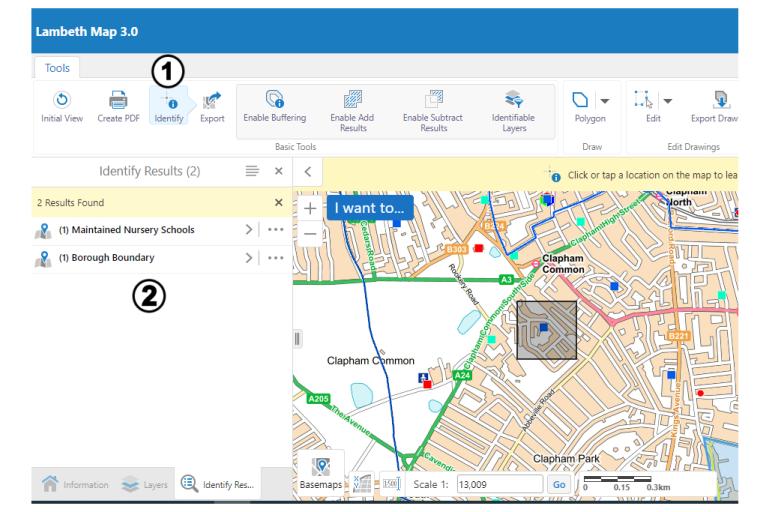
- The ‘Identify’ button lets you draw a simple polygon on the map.
- Any data layers that are turned on will be shown in the results panel.
