Creating custom layer symbology
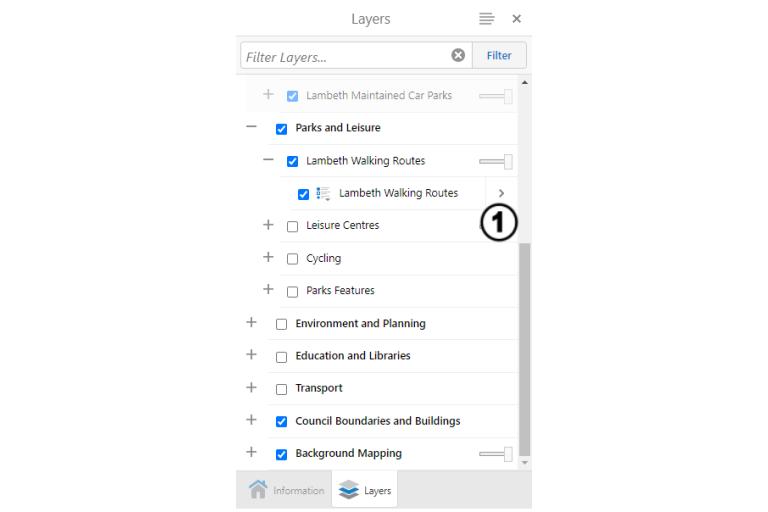
1. Use the arrow symbol button to the right of the layer name to display a list of layer options.
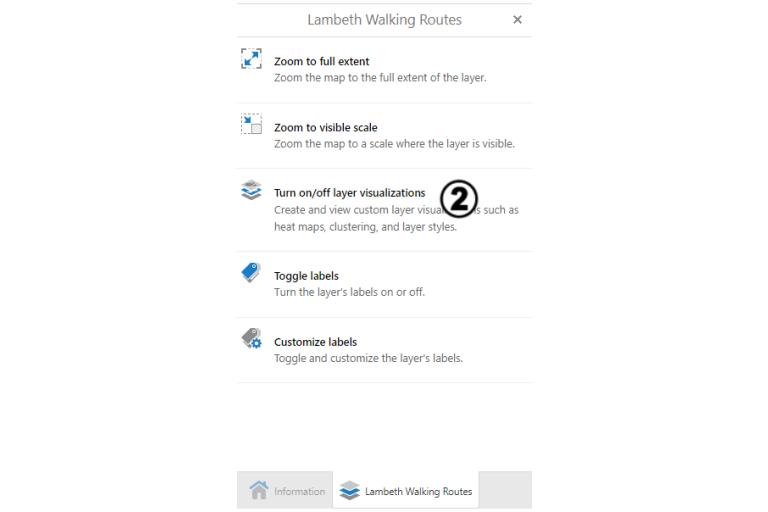
2. Click Turn on/off layer visualisations to open the Visualisation Options panel.
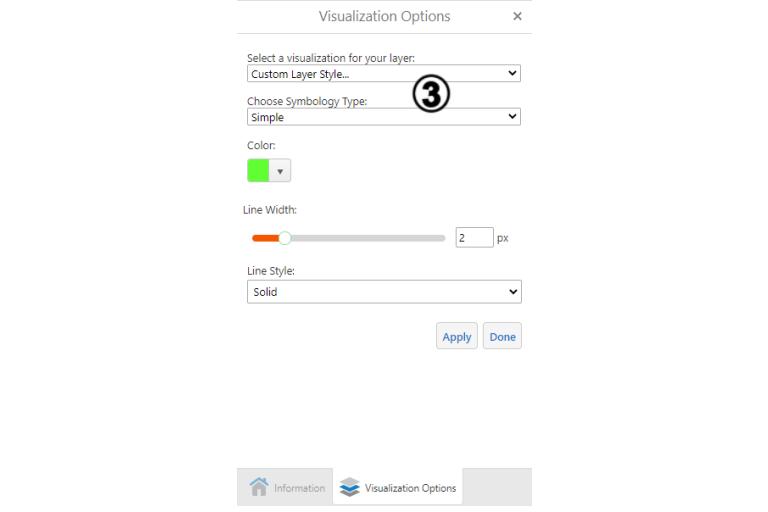
3. Select Custom Layer Style in the drop down list. Then select 'Simple' under Choose Symbology Type. Choose your fill colour and Outline Colour and click apply.
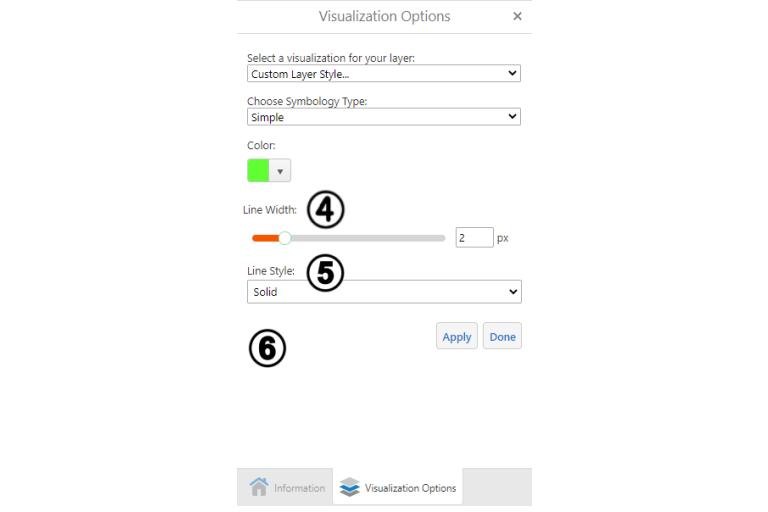
4. Use the Line Width slider or amend the numeric field to alter the line width.
5. Use the Line Style list to choose from solid or dot and dash lines.
6. Use the Fill Style list to choose from a solid or patterned fill style.
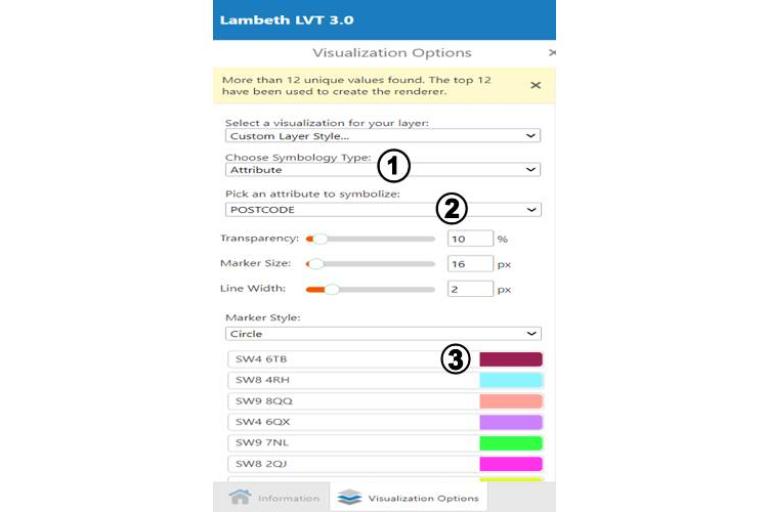
1. To change the symbology by a layer’s attribute, change the choose symbology type to attribute.
2. Select the desired attribute from the drop down list and the information will be displayed.
3. Click into any category colour to amend the symbology as shown previously.
